Interval data
Interval data (also referred to as “load profile data”) is a fine-grained record of energy or water consumption, with readings made at regular intervals throughout the day, every day.
This data contains a lot of information about a site's energy or water usage, but the sheer volume of data stored over time makes it difficult to manage and interpret. MOL makes it easy to turn this raw interval data into useful charts and reports that enables even non-technical users to visualise and understand consumption and the related related financial implications.
Interval data is widely used by professional energy auditors, consultants, and engineers for applications such as:
MOL Interval Data Analytics
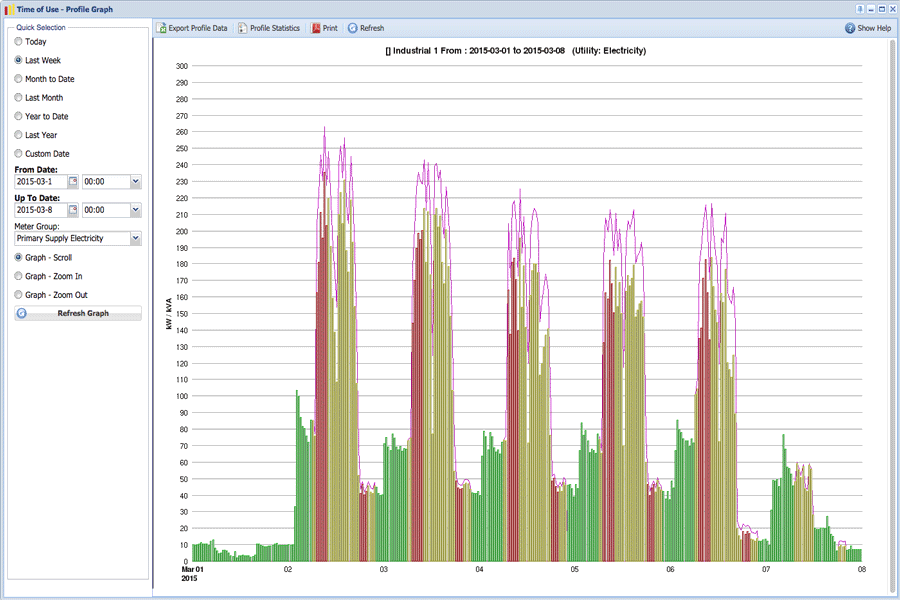
Load Profile graphs
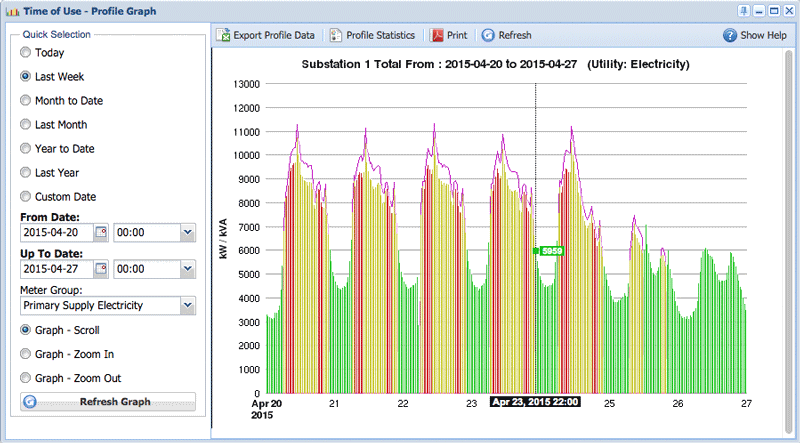
Load Profile graphs provide an interactive graphical representation of interval data.
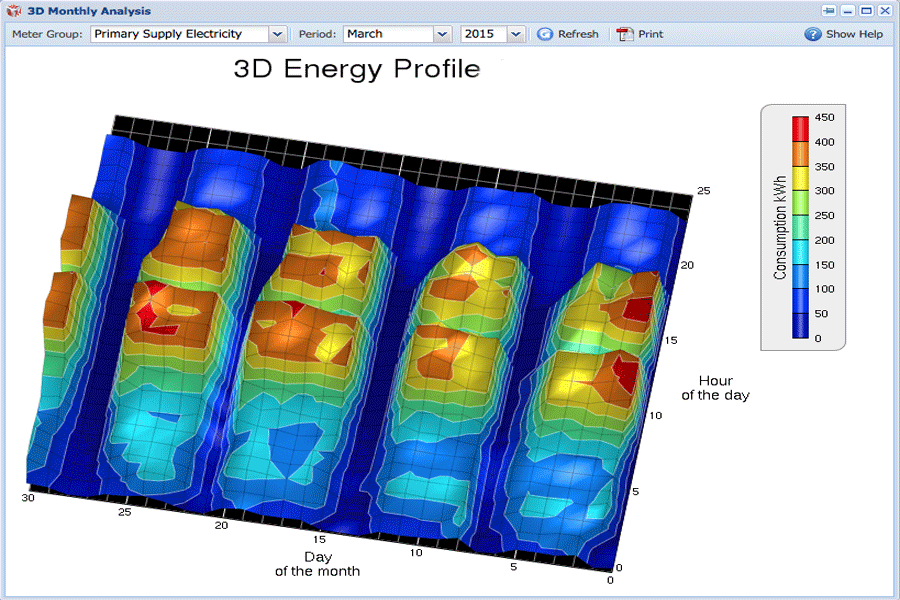
3D profile graphs
3D Profile graphical representations of interval data.
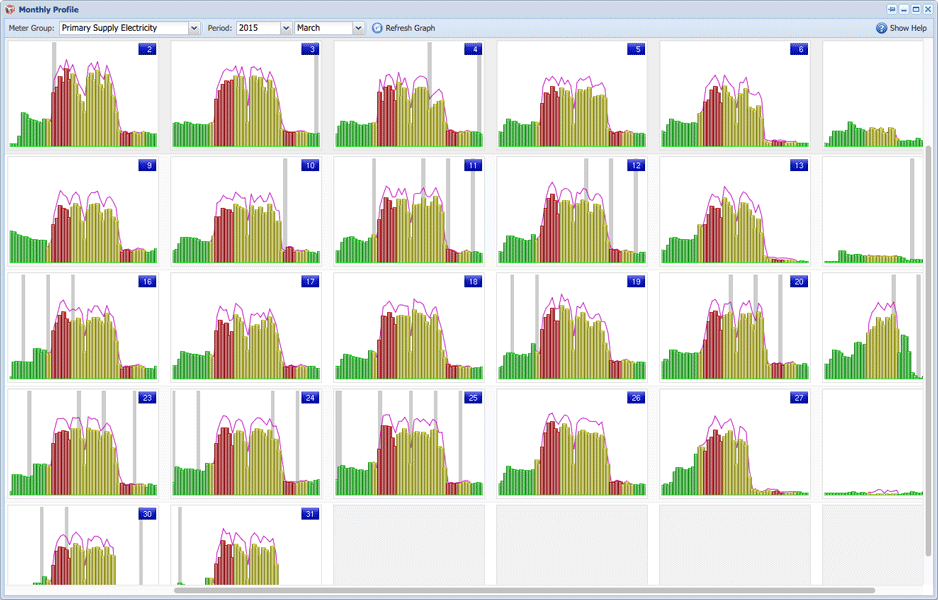
Monthly profile
The Monthly Profile utility shows a composite load profile graph that shows an overview of consumption for an entire month.
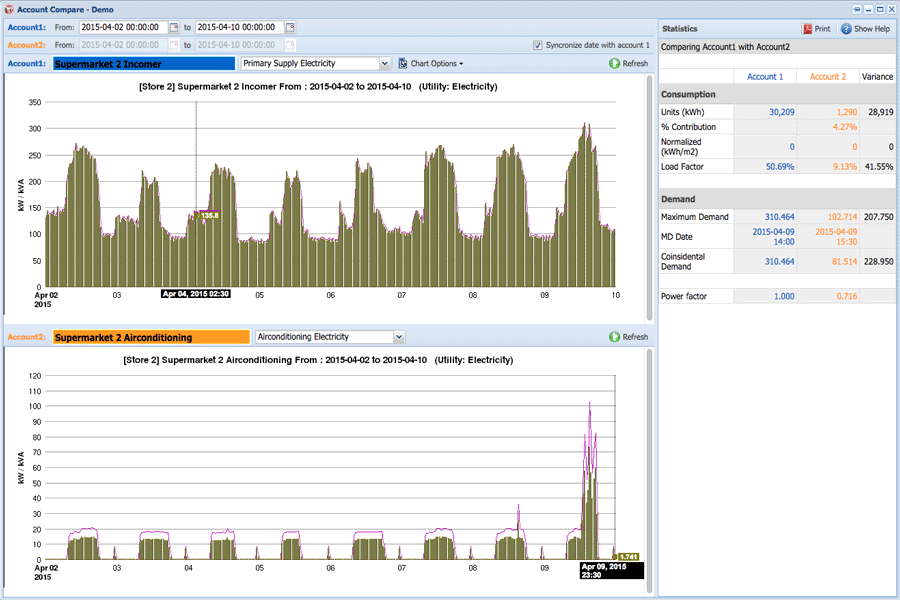
Profile comparison
The Profile Comparison tool allows direct comparison of interval data for two accounts.
Period comparison
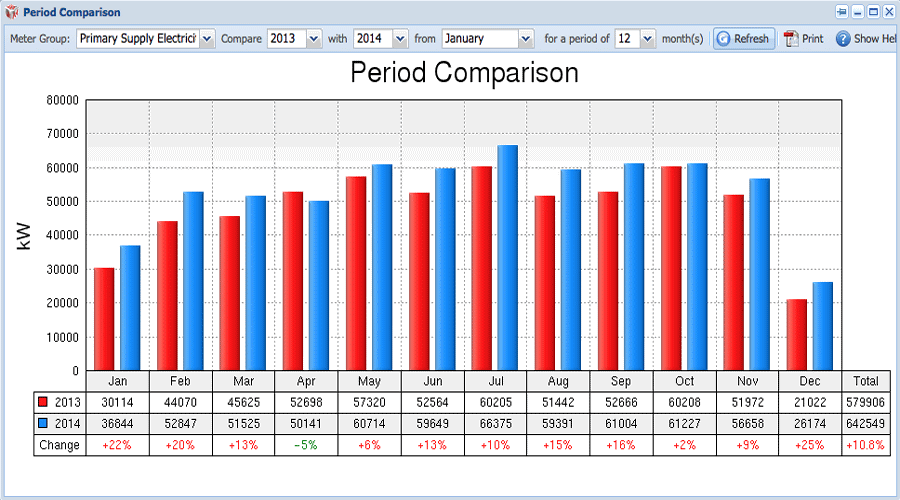
The Period Comparison utility shows the month-on-month comparative consumption for an account in both graphical and tabular form.

